Track the Crypto Market with TradingView’s Advanced Charts
To boost your financial success, digitra.com has partnered with the traders’ social network

Staying well-informed about the market increases your chances of earning with cryptocurrencies. To help you make the right investment decisions, digitra.com has partnered with TradingView, integrating advanced charts into our platform.
Here’s what you need to know about this new feature:
What are Cryptocurrency Charts?
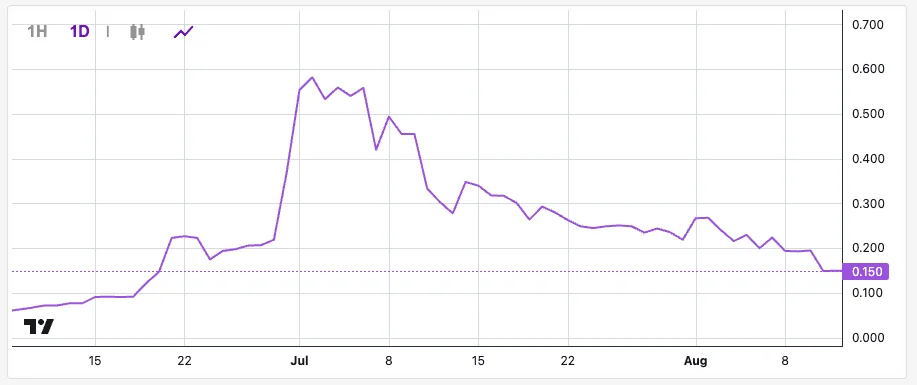
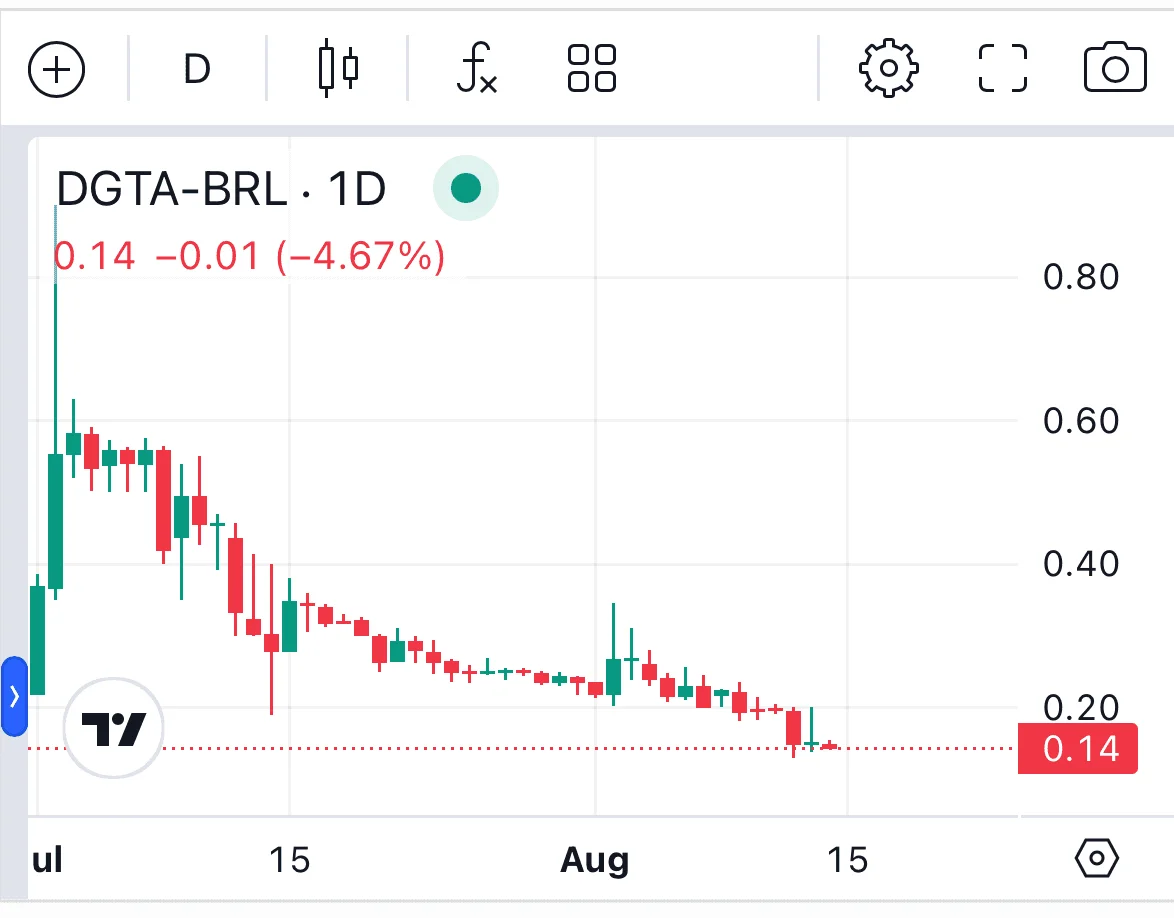
Cryptocurrency charts, like Bitcoin chart, are tools used to track the price changes over a certain period. They can be displayed in various types, such as candlestick and line grap charts.


With these tools, investors can observe how the currency's value has behaved over time, gain a better understanding of the current market state of the asset, and identify market behavior patterns.
The Importance of the Right Tool
In addition to prior knowledge of market analysis and indicators, investors need the ideal tool to conduct in-depth studies using advanced charts and technology.
Understanding this, we sought out TradingView as a partner to bring more ease and technology to our clients’ analyses. Together, we offer market intelligence and advanced technology in the charts of the currencies available for trading on our platform.
Keeping an Eye on the Price
With this new feature, it’s easier for our users to track the price movements of currencies and easily perform indicator studies.


